Mastering Analytics In Finance For Enterprise Success
Analytics in finance turns transaction data, market feeds, and ERP records into forecasts a finance team can act on: cash flow projections that update daily instead of monthly, fraud scoring on live transactions, and risk models that shift as conditions change instead of waiting for a quarterly review. The payoff lands in three places - lower costs from automated processes, higher revenue from better pricing and demand decisions, and losses avoided through earlier detection.
Financial analytics work is common enough among data engineering specialists that 57 of the 86 firms profiled in the Data Engineering Companies Index list fintech experience, and 68 list analytics and BI capabilities - the harder part is finding a partner who can get a model into a production pipeline your finance team actually trusts, not just one who can build a proof of concept.
This guide covers:
- The four types of financial analytics and how they build on each other
- How to calculate ROI and make the business case to a finance-literate board
- The five highest-impact use cases, from cash flow forecasting to treasury optimization
- The data architecture and platform choices that support real-time analytics
- A phased implementation roadmap and an RFP evaluation checklist
What is analytics in finance, and how does it differ from static reporting?
Analytics in finance replaces static, backward-looking spreadsheets with a live view of cash flow, risk, and performance that updates as new data arrives. Instead of waiting for a monthly close to find out a number moved, finance teams see the shift as it happens and have time to act on it.
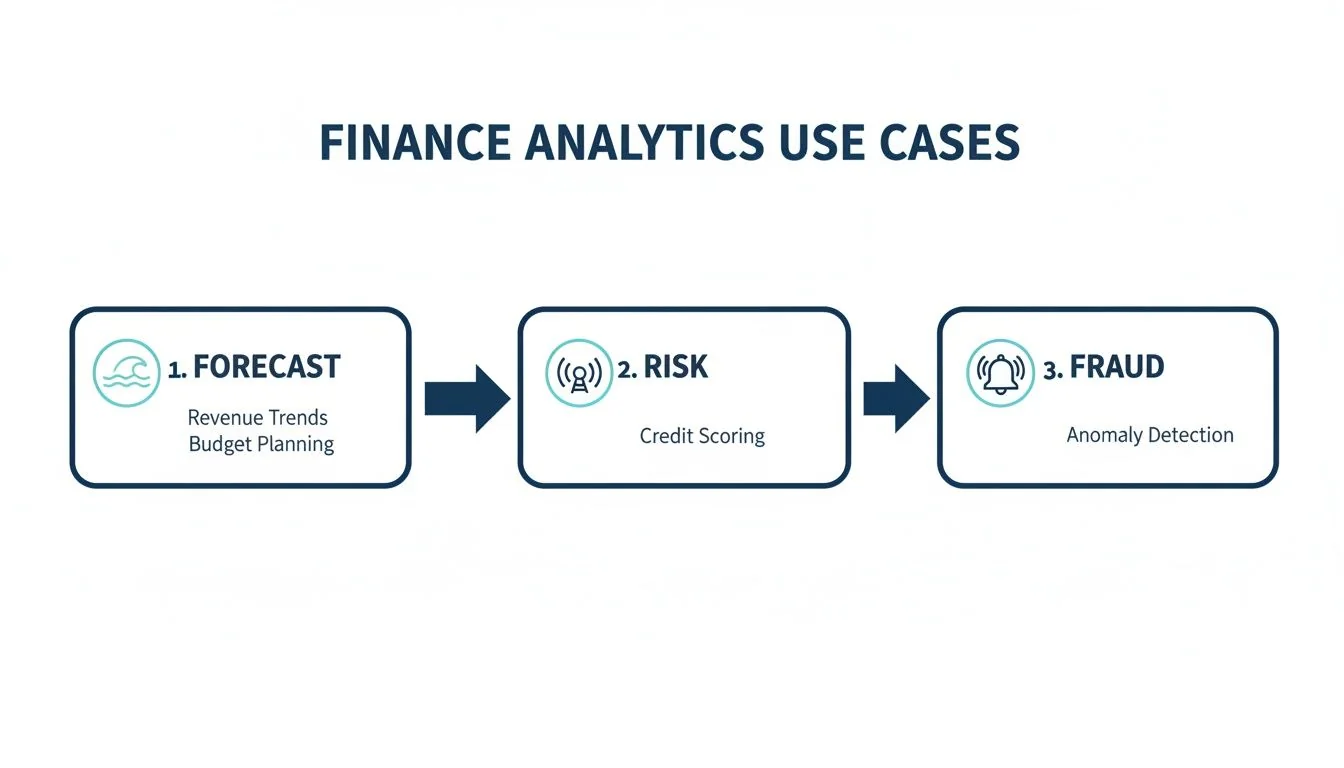
A static report tells you what happened last month. Analytics layers context, speed, and forecasting on top of that same data, turning historical numbers into a forward-looking view - a stress test that used to take days of manual spreadsheet work can run in minutes, giving teams time to reallocate budget before a demand shift actually hits.
What are the four types of financial analytics?
Financial analytics breaks into four layers, each building on the one before it: descriptive analytics explains what already happened, diagnostic analytics explains why, predictive analytics estimates what happens next, and prescriptive analytics recommends what to do about it.
- Descriptive analytics reviews past results - revenue, expenses, and variances against plan.
- Diagnostic analytics digs into root causes once a descriptive report flags a problem.
- Predictive analytics forecasts likely outcomes using historical patterns and current signals.
- Prescriptive analytics recommends a specific action, not just a forecast.
Most finance teams already do descriptive and diagnostic work in spreadsheets. The jump that actually changes decision-making is predictive and prescriptive analytics, which requires a data pipeline stable enough to feed a model reliably - see our modern data stack framework for how the underlying infrastructure supports each layer.
Key takeaways
- Start with descriptive reviews to anchor a shared understanding of the numbers
- Use diagnostic checks to pinpoint the cause before proposing a fix
- Use predictive models for planning, not just historical reporting
- Apply prescriptive recommendations only once the first three layers are trustworthy
How do you build the business case and calculate ROI?
Finance executives evaluate analytics projects in dollars, not feature lists. Tie every initiative to one of three outcomes: cost savings from automation, revenue uplift from better decisions, or risk reduction from earlier detection - then use NPV and IRR to compare projects the same way finance already compares any other capital request.
Mapping initiatives to metrics
Document the data inputs, outputs, and resource requirements for each workflow so you can calculate a real cost per process instead of estimating one. A fraud detection pilot, for example, can be sized by comparing the dollar value of fraudulent charges it actually blocks against what it cost to build and run - use observed numbers from the pilot, not projected ones, when you present the case to the board.
Scenario-based ROI
ROI = (Total Benefits - Total Costs) / Total Costs
Build three scenarios - best, expected, and worst case - so the range you present is realistic rather than a single optimistic number.
| Metric | Definition | What to track |
|---|---|---|
| Cost savings | Dollars saved through process automation | Hours removed from manual close and reporting work, converted to loaded labor cost |
| Revenue uplift | Additional income from analytics-informed pricing, cross-sell, or demand decisions | Incremental revenue attributable to a specific model, isolated from other initiatives running at the same time |
| Risk reduction | Losses avoided through earlier detection and tighter compliance | Change in confirmed fraud or credit losses measured against your own pre-analytics baseline |
There’s no universal benchmark for what these numbers should be - they vary by industry, process, and how the workflow was measured before. Track leading indicators (faster reports) alongside lagging indicators (actual dollars saved) so early wins have something concrete behind them by the time you report on ROI.
Your own before-and-after numbers will carry more weight with your board than an industry-wide estimate.
What are the highest-impact use cases?
Financial analytics delivers measurable value across five recurring use cases: cash flow forecasting, risk analytics, real-time fraud detection, performance dashboards, and treasury optimization. Each one replaces a periodic, manual process with a continuous, model-driven one.
Cash flow forecasting
Cash flow forecasting models near-term liquidity from receivables, payables, and expected transaction volume, replacing static month-end snapshots with a rolling view that updates as new transactions post. Working-capital-intensive businesses like retailers use optimistic, base, and pessimistic scenarios to stress-test liquidity before a cash crunch happens, not after.
Risk analytics
Risk analytics applies probabilistic models to credit, market, and operational exposure instead of relying on static credit scores or a scheduled annual review. A bank running dynamic stress-testing can reassess exposure as market conditions shift in real time, rather than discovering the impact at the next quarterly cycle.
| Use case | What it does | Primary benefit |
|---|---|---|
| Cash flow forecasting | Projects future liquidity needs from live transaction data | Reduces working capital tied up in receivables and payables |
| Risk analytics | Runs probabilistic scenarios against credit and market exposure | Surfaces risk earlier than a scheduled review would |
| Fraud detection | Scores transactions in real time using behavioral signals | Cuts fraud losses and reduces false positives sent to analysts |
| Performance dashboards | Visualizes revenue, expense, and KPI data continuously | Shortens the time between a number changing and a decision |
| Treasury optimization | Fine-tunes liquidity, funding, and hedging decisions | Improves returns on cash and reduces FX exposure |
Real-time fraud detection
Real-time fraud detection scores transactions as they happen using behavioral and network signals, rather than static rule lists, and routes only the highest-risk transactions to a human analyst. That shift - from reviewing everything to reviewing what the model actually flags - is what lets a fraud team handle rising transaction volume without adding headcount at the same rate.
Performance dashboards
Performance dashboards replace static monthly decks with a live view of revenue, expenses, and KPIs that updates as transactions post, so review meetings focus on deciding what to do about a number instead of debating whether it’s current. For a deeper comparison of BI and dashboard tooling, see BI software comparison.
Treasury optimization
Treasury optimization uses forward-looking cash, FX, and interest rate forecasts to decide where to hold funds and when to hedge, instead of managing liquidity off a static monthly report. Manufacturers carrying debt across multiple currencies and rate structures use this approach to time refinancing and hedging decisions ahead of a rate move, not in reaction to one.
Across all five use cases, the constant is a data pipeline reliable enough that finance trusts the number without double-checking it in a spreadsheet first.
What does the data architecture behind financial analytics look like?
Data architecture is the infrastructure that moves raw figures from source systems into a form analysts and models can actually use, without slowing down or corrupting the live reports finance already depends on.
Pipeline components
- Raw data ingestion from ERP, CRM, and market data sources
- ETL processes that cleanse and transform data before it reaches analysts
- Data lakes for structured tables and unstructured logs alike
- Analytics sandboxes for rapid model prototyping without touching production data
Structured vs. unstructured data
Combine schema-on-write for financial tables, where structure and accuracy matter most, with schema-on-read for logs and unstructured sources. Cloud platforms let you scale storage and compute independently, so a spike in log volume doesn’t force you to over-provision the compute used for structured financial reporting.
Platform comparison
| Feature | Snowflake | Databricks |
|---|---|---|
| Compute elasticity | Auto-scale and auto-suspend warehouses | Dynamic clusters and pools |
| Data processing | SQL-based ELT | Apache Spark for ETL and ML |
| Concurrency | Dedicated compute per warehouse | Shared compute across workloads |
| Cost model | Per-second billing | DBUs plus compute usage |
Match the platform to your peak load pattern and budget model rather than picking on brand recognition alone - see Snowflake’s warehouse documentation and Databricks’ compute documentation for how each handles scaling in practice.
Quality and governance
Data quality and lineage determine whether anyone actually trusts the numbers coming out of the pipeline. Trace each figure back to its source and every transformation it went through, and embed validation checks at the start of the pipeline rather than after a bad number has already reached a dashboard. For a fuller framework, see data governance consulting.
- Document data flows and monitor pipeline health continuously
- Implement access controls so the environment holds up under an audit
- Revisit the architecture as reporting and compliance needs evolve
How do you roll out financial analytics without a failed pilot?
A phased rollout breaks the project into four stages - discovery, proof of concept, pilot deployment, and enterprise rollout - so architecture and tooling decisions get tested on a small scale before they’re locked in for the whole organization.
Phase details
| Phase | Duration | Deliverables |
|---|---|---|
| Discovery | 2-4 weeks | Data inventory, use-case list, project charter |
| POC | 4-8 weeks | Prototype models, KPI dashboard, stakeholder feedback |
| Pilot | 6-12 weeks | Live integration, performance baselines |
| Rollout | 3-6 months | Training, change management, ongoing support |
Define data stewards and approval workflows during discovery, not after the pilot, and confirm early how the architecture will satisfy SOX, GDPR, or whatever compliance regime applies to your data.
Cost and engagement models
Compare three ways to staff the work:
- In-house team, using existing staff and institutional knowledge
- External consultant, for a faster ramp-up on unfamiliar tooling
- Hybrid, pairing internal staff with specialist support where the gap actually is
Key cost drivers are storage and compute, personnel, software licenses, and training - model each scenario against your actual budget rather than a generic industry estimate.
RFP evaluation
Evaluate vendors against a consistent set of criteria:
| Criterion | What to assess |
|---|---|
| Performance | Query times and concurrency at peak volume |
| Scalability | How the platform handles growing data and user load |
| Support | SLA terms and escalation paths |
| Pricing | List rates, discounts, and any hidden fees |
| Governance | Security certifications and audit support |
Weight each criterion, request client references, and compare total cost over a 3-5 year horizon rather than the first-year quote alone. For a structured starting point, see our data engineering RFP checklist.
Keep the vendor relationship active with regular updates, live demos, and feedback loops after go-live, and track adoption rates, data quality scores, and time-to-insight to know whether the rollout is actually working.
FAQ
Q: How does analytics in finance differ from static reporting? A: Analytics gives finance teams a continuously updated view of cash flow and emerging risk, so budget adjustments happen in hours instead of waiting for the next reporting cycle. See “What is analytics in finance” above.
Q: How do I build a business case? A: Link each initiative to cost savings, revenue uplift, or risk reduction, model best, expected, and worst-case scenarios, apply the ROI formula, and use your own pilot numbers rather than industry benchmarks. See “How do you build the business case and calculate ROI.”
Q: What data foundation supports real-time analytics? A: A hybrid schema-on-write and schema-on-read approach that supports both streaming ingestion and structured financial reporting. See “What does the data architecture behind financial analytics look like.”
Q: How do I enforce governance and compliance? A: Assign data stewards, establish approval workflows during discovery, maintain audit trails, and use policy-as-code tools to enforce access permissions. See “How do you roll out financial analytics without a failed pilot.”
Once you’ve scoped the use case and the architecture, the data engineering RFP checklist and modern data stack framework are the next two stops for vetting a build partner.
Researched & written by
Data-driven market researcher with 20+ years in market research and 10+ years helping software agencies and IT organizations make evidence-based decisions. Former market research analyst at Aviva Investors and Credit Suisse.
Previously: Aviva Investors · Credit Suisse · Brainhub · 100Signals
Vetted partners
Top Fintech Partners
Vetted firms whose specialty matches this article.
More in FinTech Data Engineering
The Actionable Guide to Data Analytics in the Insurance Industry (2026)
How data analytics transforms the insurance industry: AI-driven risk scoring, IoT-based underwriting, fraud detection, and claims automation with real-world ROI benchmarks.
The Real Cost and Timeline of a Data Mesh Consulting Engagement
A guide to data mesh consulting for engineering leaders. Learn to scope projects, select partners, and implement a data mesh that delivers business value.
A Practical Guide to Cloud Data Integration for Modern Data Stacks
Discover cloud data integration essentials, compare ETL vs ELT, and learn to secure and optimize your data strategy with trusted partners.